Delivery Dashboard
A Flexible Approach to Design and Screen Responsiveness
Data Source
This project utilizes supply chain data from DataCo Global, which includes comprehensive records of deliveries, customers, orders, and products.
Business Objective
The aim of the project was to create an interactive dashboard for tracking delivery KPIs. This dashboard should enables users to monitor critical metrics while providing detailed insights to support data-driven decision-making.
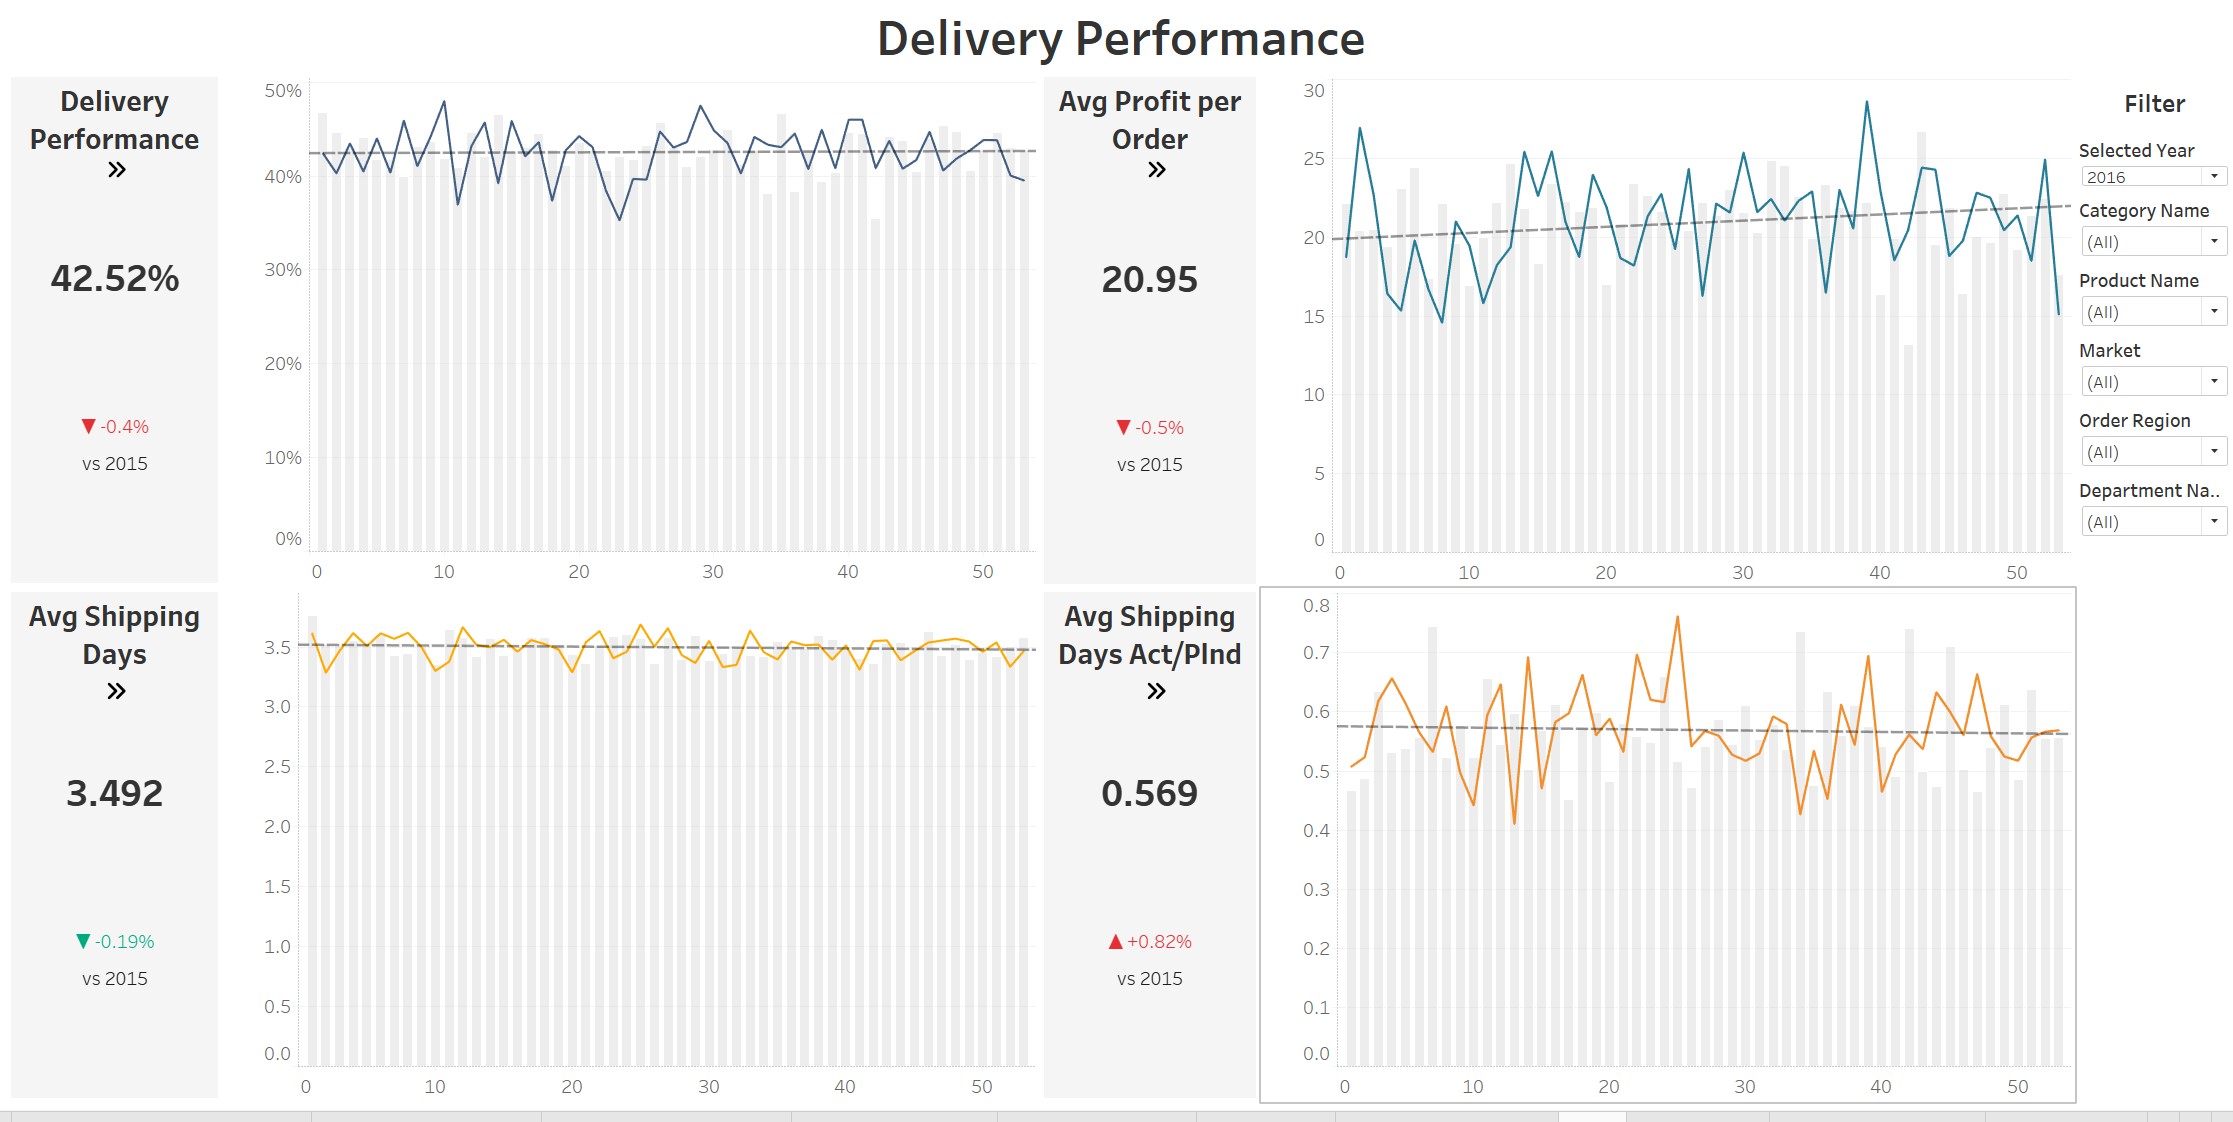
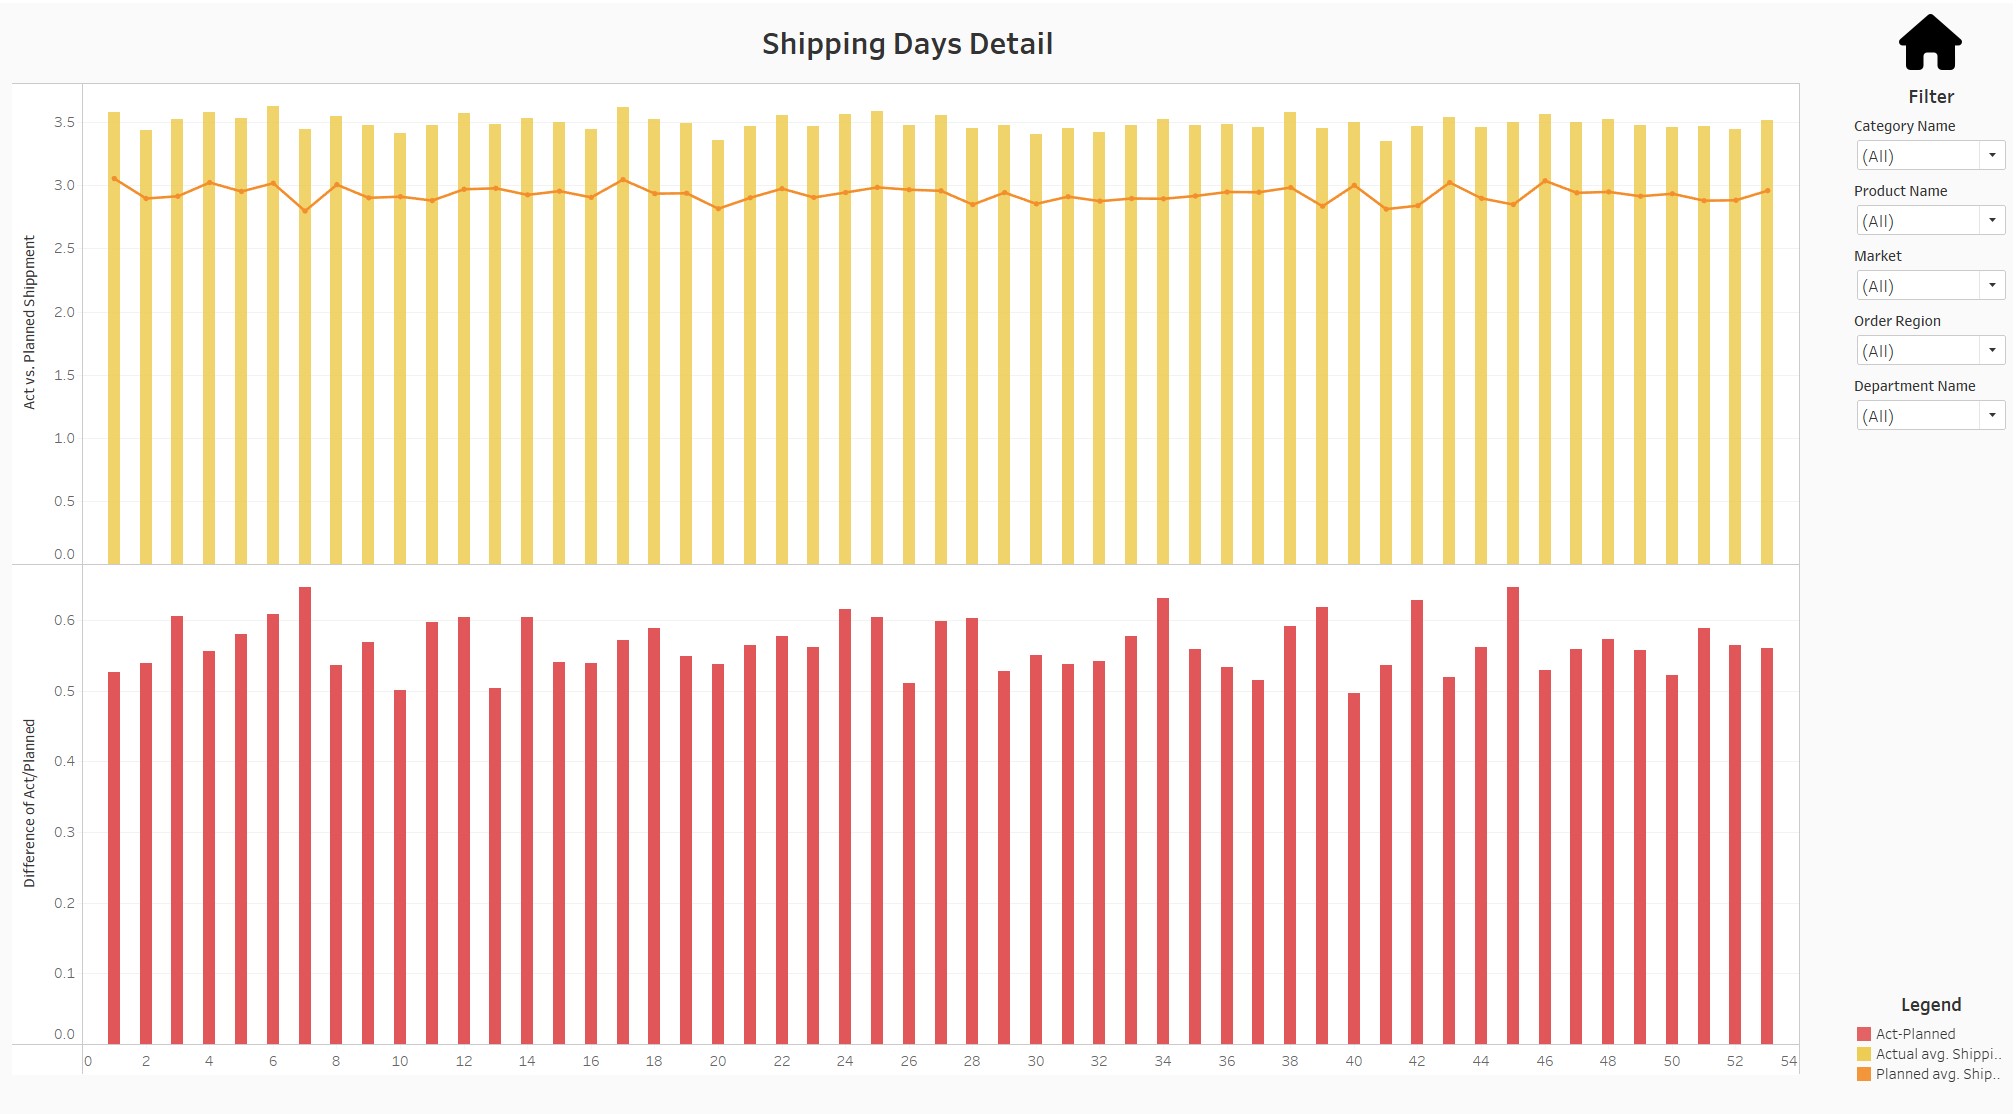
- KPI Overview
- Tracks delivery performance metrics, including on-time delivery rates, shipping days, and comparisons between actual and planned shipping days.
- Displays profit per order to evaluate financial outcomes.
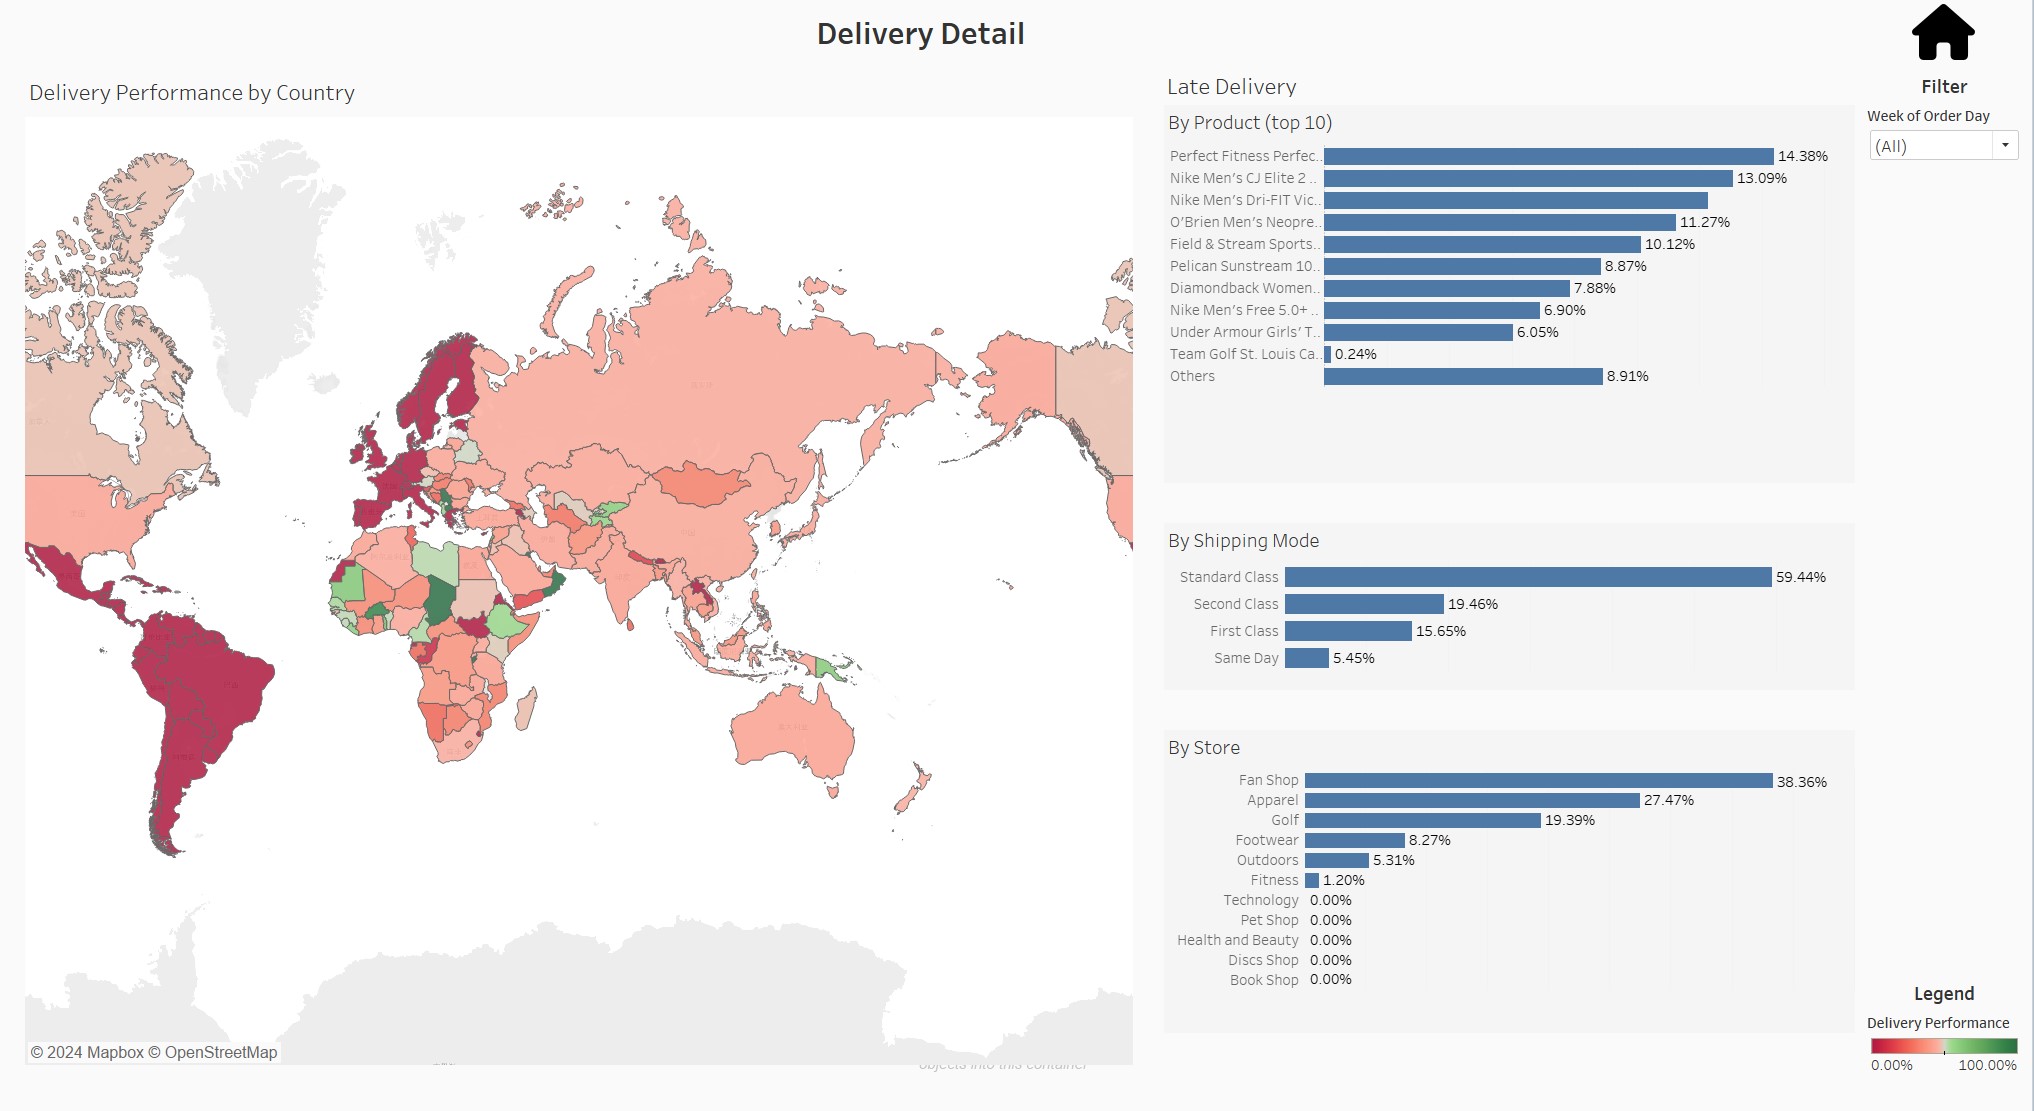
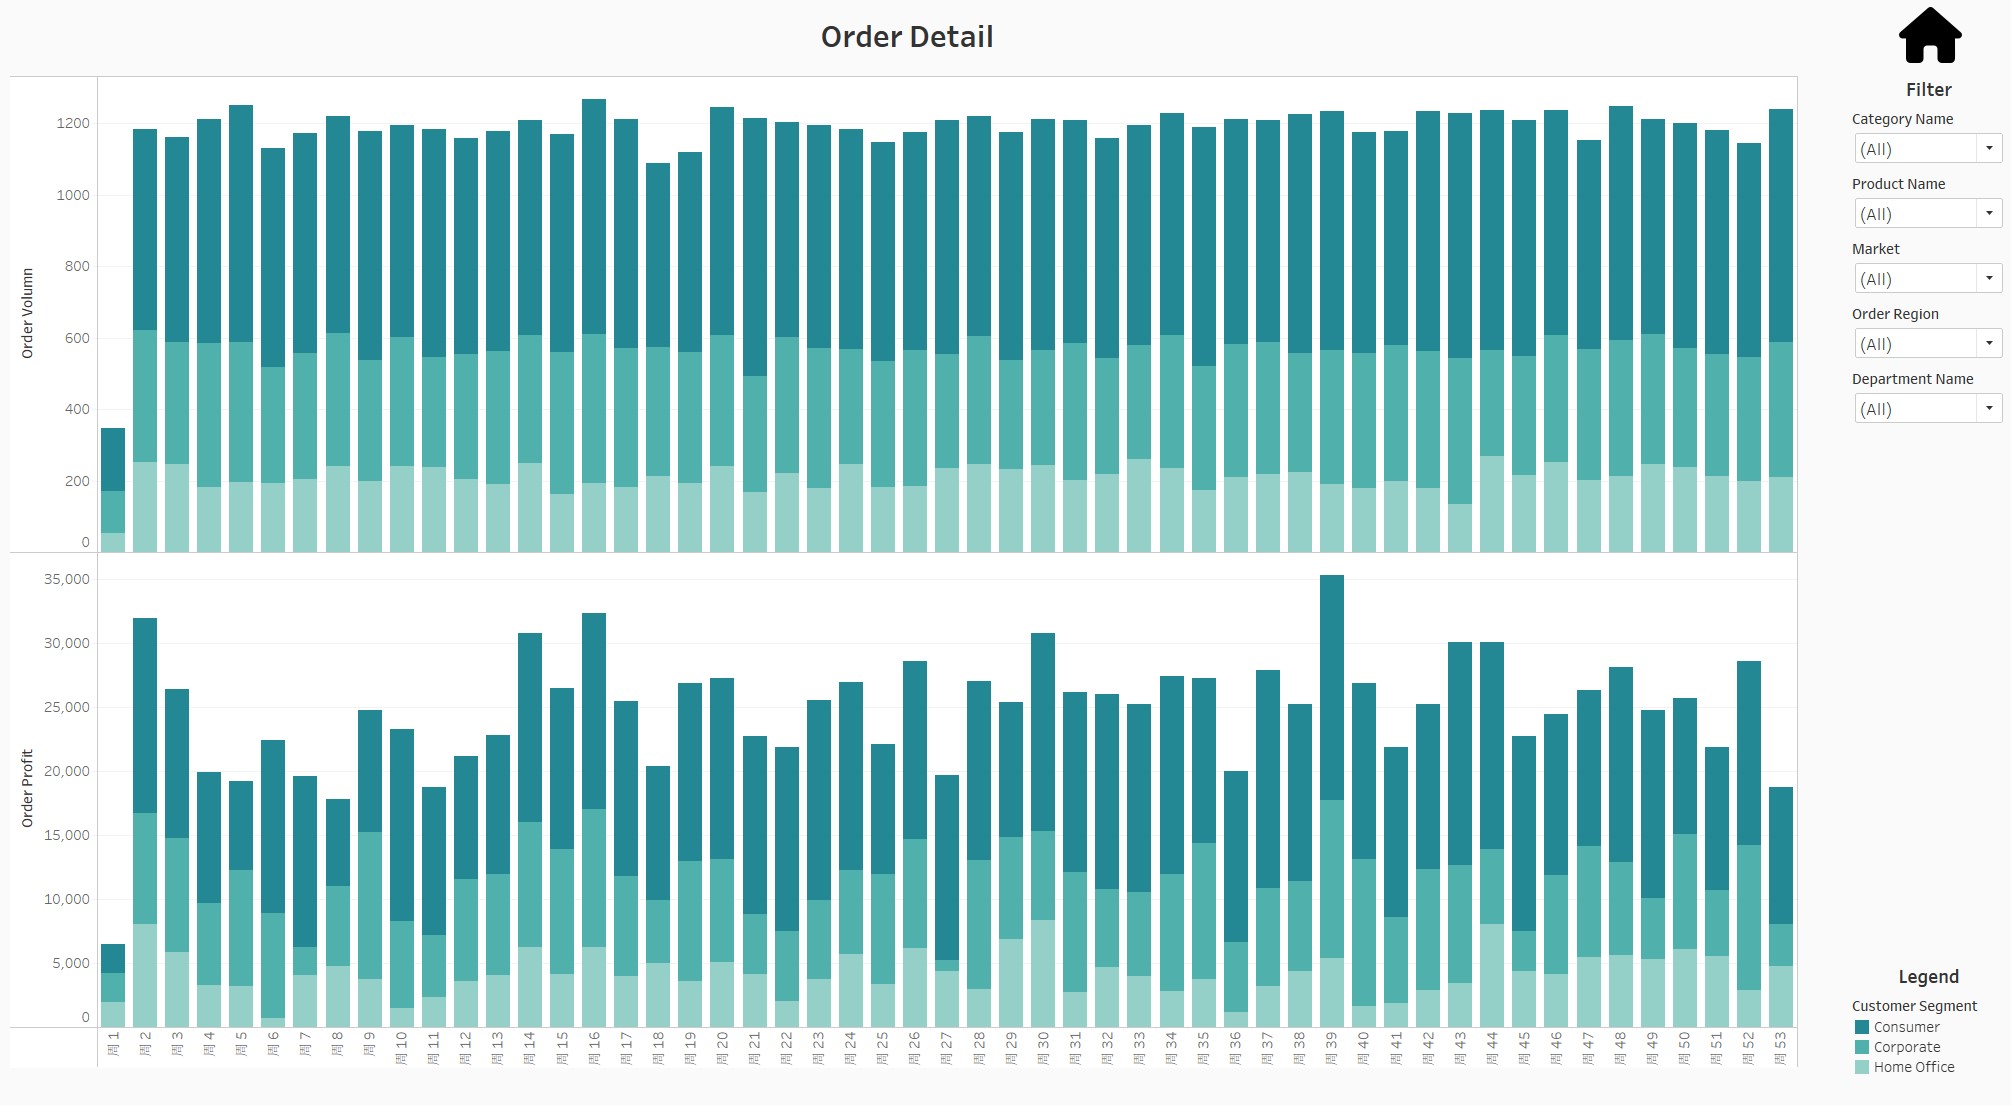
- Detailed views
- Offers focused views for each KPI, helping users identify trends and areas for improvement, including delivery, order and shipping days details.
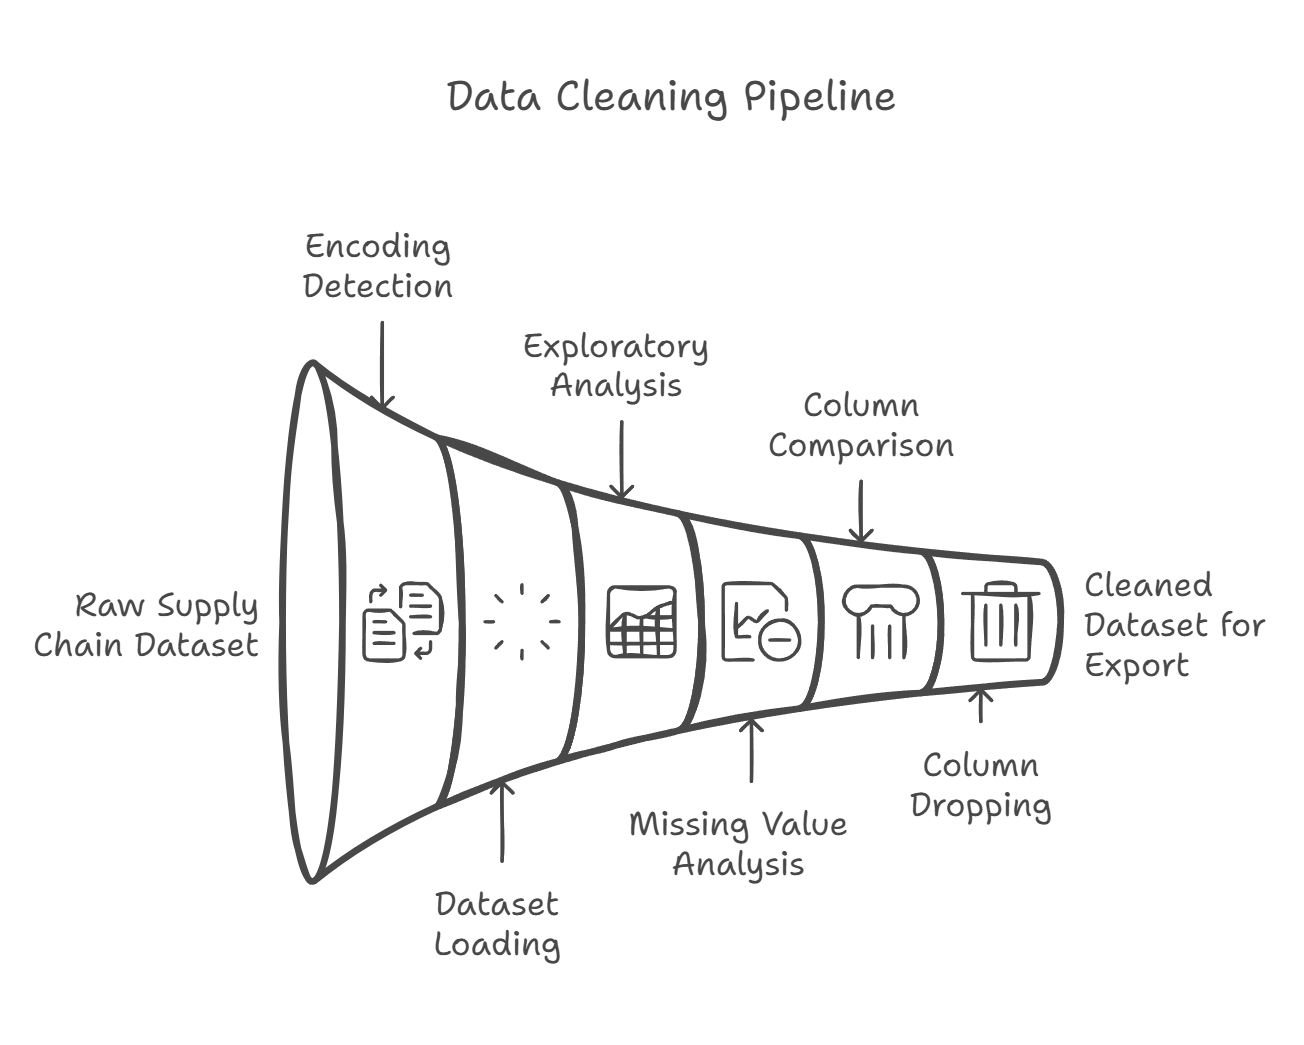
Data Cleaning and Transformation
The raw data, presented in tabular format, was cleaned and transformed using Python. The main task of this step is to understand the dataset, and identifies missing values or redundant columns. Unnecessary columns are removed, and a subset of relevant delivery-related columns is extracted. Finally, the cleaned data is saved to an Excel file for the next step.
The python code can be accessed on GitHub.
Dashboard Creation
The dashboard was built using Tableau and is adaptable to various screen sizes.
Dashboard Size: Optimizing for Screen Responsiveness
Choosing the right dashboard size is crucial for user experience, especially considering the diverse range of screen sizes used by end users. Tableau provides three options for dashboard sizing: fixed size, range size, and automatic. From my experience, the automatic sizing option is the most effective choice for creating responsive dashboards.
Tips for Designing Responsive Dashboards in Tableau:
- Set the Size to Automatic: This allows the dashboard to dynamically adjust to different screen dimensions, ensuring a seamless viewing experience.
- Use Floating Containers: Organize charts, tables, and navigation elements within floating containers. This design approach ensures that components scale and reposition appropriately as screen sizes change.
- Test Across Resolutions: Preview and test the dashboard on different sizes of screens to confirm a smooth experience for all end users.
- Leverage Padding and Margins: Use padding and margin settings to create buffers around elements, maintaining a clean appearance across screen sizes.
The delivery dashboard can be accessed on Tableau Public.