Sales Dashboard
Data Source
The data source for this project is the AdventureWorks sample databases provided by Microsoft. It contains tables related to sales, customers, products, and other business entities.
Business Request
The goal of this project is to create a comprehensive sales report with an intuitive dashboard. The dashboard should provide:
- An overview of internet sales, including total sales, sales trends over time, and a comparison of actual sales against budgeted targets.
- Detailed views of sales per customer and per product, allowing for analysis of top-performing customers and products.
Data Cleaning and Transformation
The databases were accessed using SQL Server for data cleaning and transformation. Three essential dimension tables were created:one for customers, another for products, and a date table. Additionally, sales data were extracted and stored as a fact table for next step.
Below are the SQL commands for cleaning and transforming the product data. Additional SQL scripts for other necessary data can be found here.
-- Clean product table DIM_Products Table --
SELECT
  p.[ProductKey],
  p.[ProductAlternateKey] AS ProductItemCode,
  p.[EnglishProductName] AS [Product Name],
  ps.EnglishProductSubcategoryName AS [Sub Category], -- Joined in from Sub Category Table
  pc.EnglishProductCategoryName AS [Product Category], -- Joined in from Category Table
  p.[Color] AS [Product Color],
  p.[Size] AS [Product Size],
  p.[ProductLine] AS [Product Line],
  p.[ModelName] AS [Product Model Name],
  p.[EnglishDescription] AS [Product Description],
  ISNULL (p.Status, 'Outdated') AS [Product Status]
FROM
  [AdventureWorksDW2019].[dbo].[DimProduct] AS p
  LEFT JOIN dbo.DimProductSubcategory AS ps ON ps.ProductSubcategoryKey = p.ProductSubcategoryKey
  LEFT JOIN dbo.DimProductCategory AS pc ON ps.ProductCategoryKey = pc.ProductCategoryKey
ORDER BY
  p.ProductKey ASC
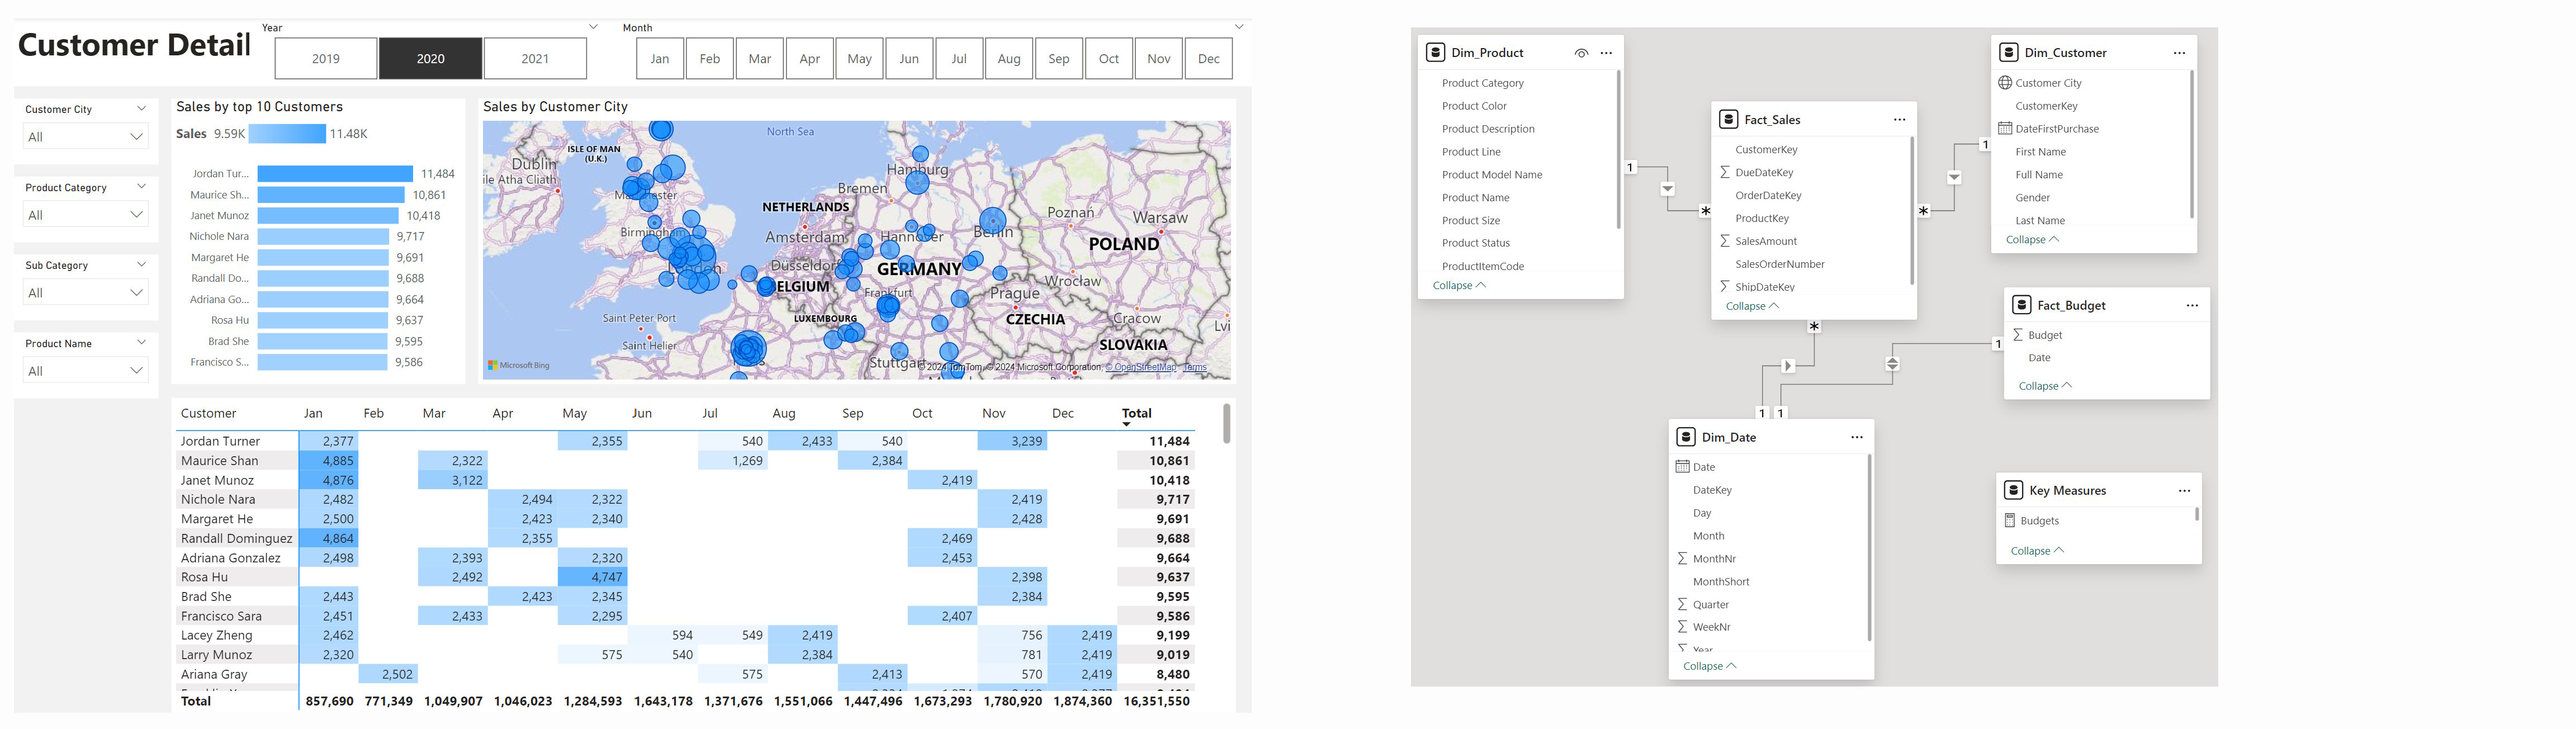
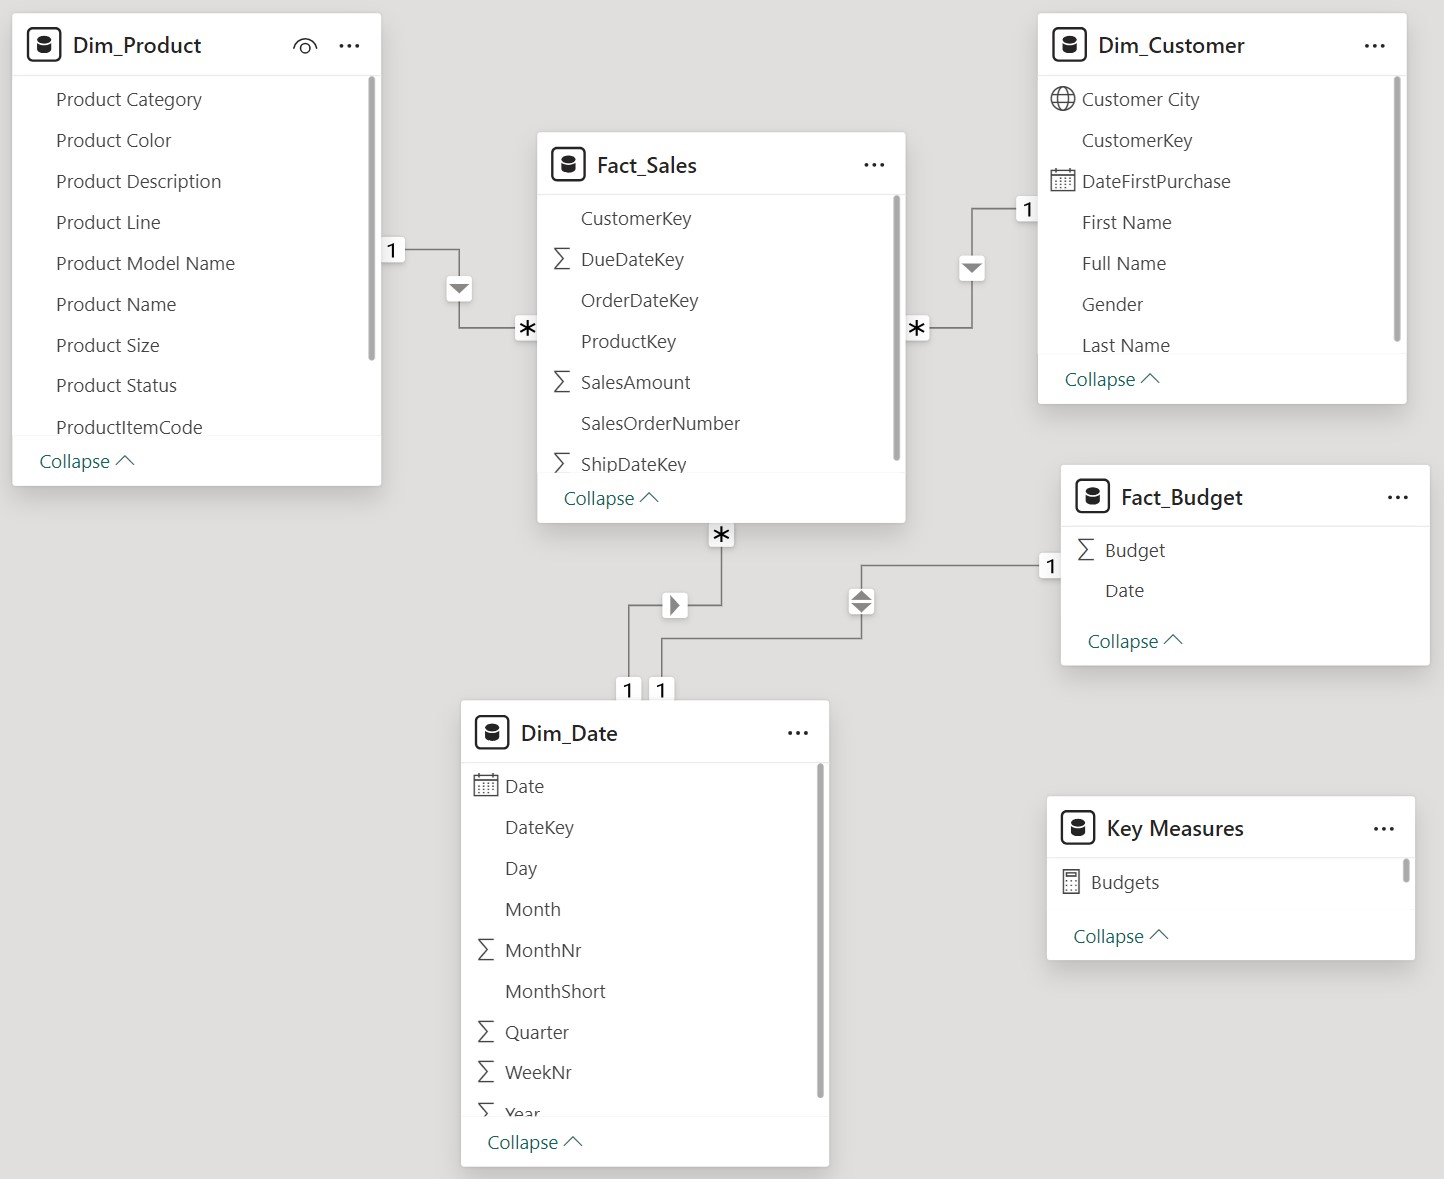
Data Modeling
The cleaned and transformed data were then loaded into Power BI, where a data model was created. In this step the sales budgets from Excel also integrated into the data model.The screeshot below shows how the fact table is connected to other dimension tables.
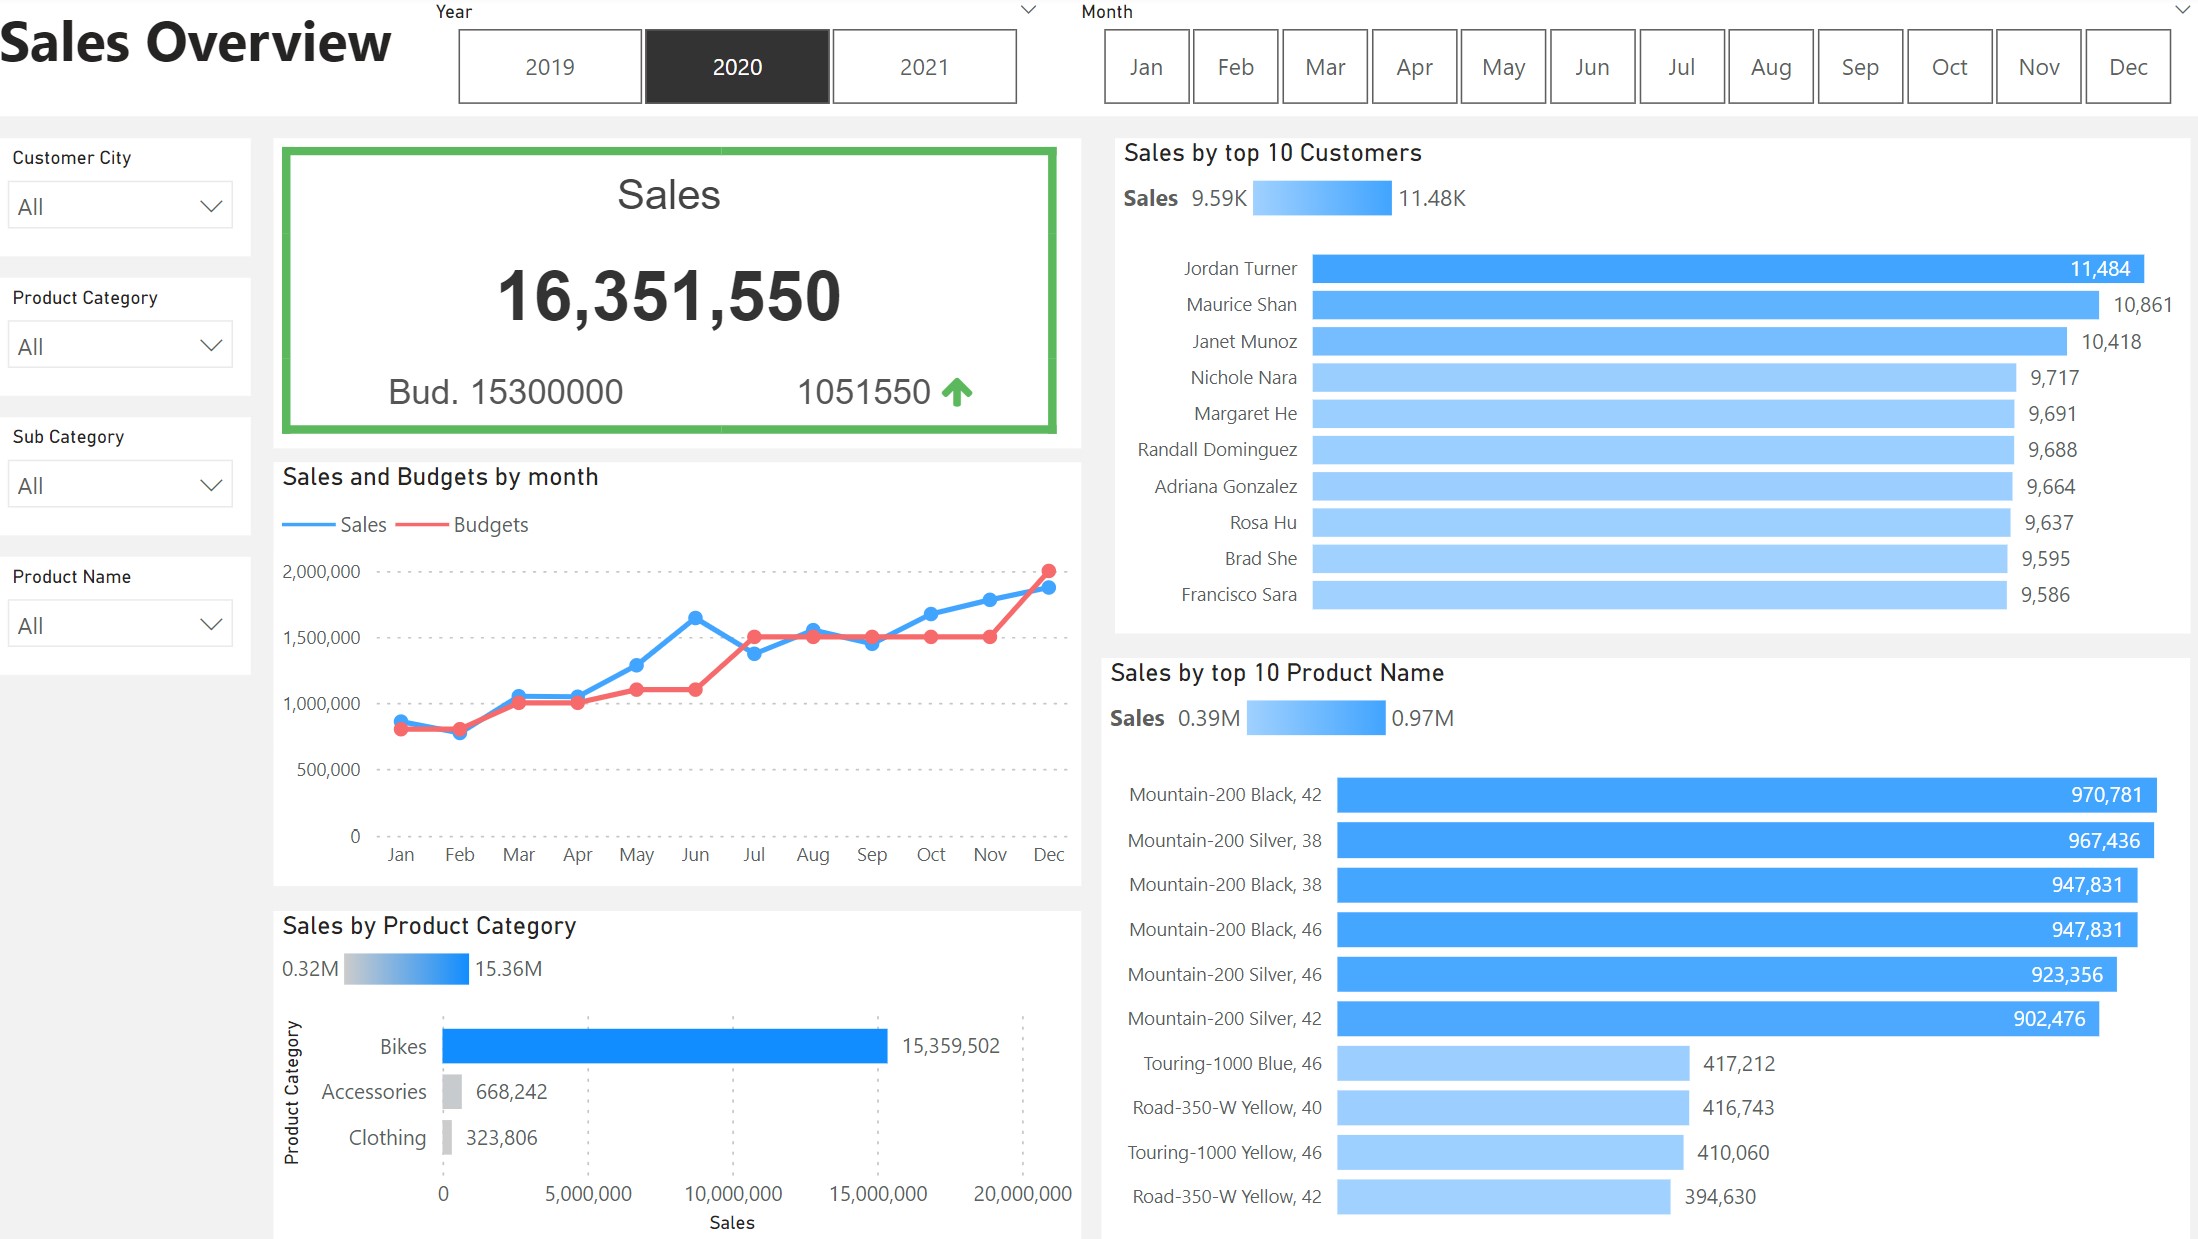
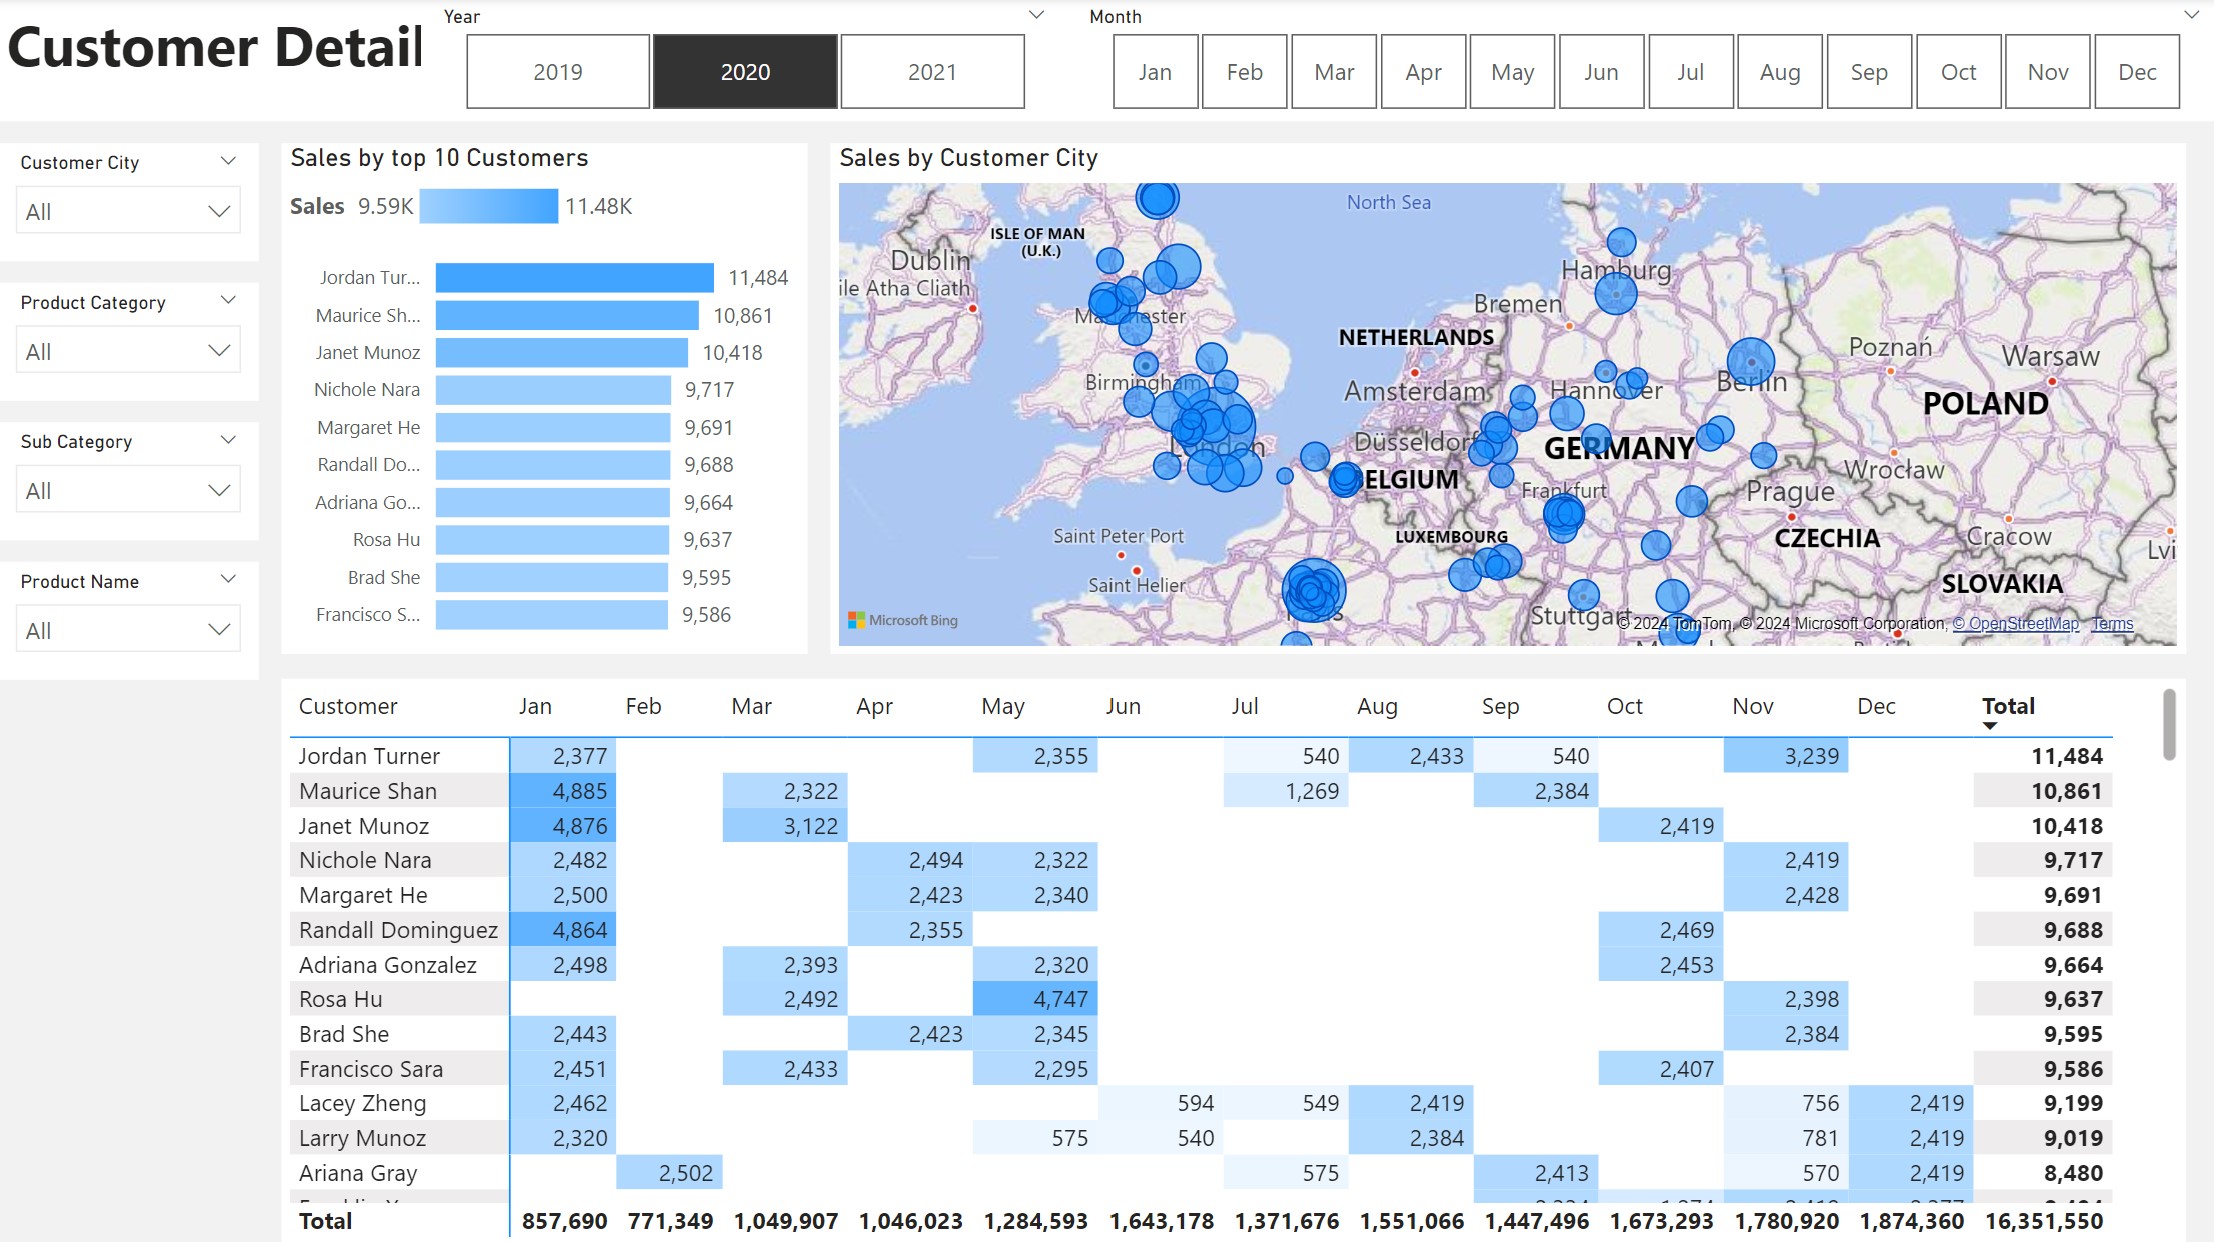
Dashboard Creation
Using Power BI, a dashboard was created based on the data and data model. The dashboard encompasses key facets: a sales overview presenting internet sales with trends and budget comparisons and other two views providing in-depth insights into sales, one focusing on customer transactions and the other on product sales.
The file of Power BI can be accessed here.